What is a heatmap?
Basically, a heatmap is a graphical representation of the location of one or more players within a field of play. This representation is made on the basis of information, which can be collected in different ways.
In the case of OLIVER, the information comes from GPS data. This device is placed on the player's leg, so it is extremely accurate and collects a large amount of information. Other ways of measuring, for example, are based on "events", which gives rise to "curious" heatmaps, which have gone viral on social networks.
What is the heatmap for?
GPS technology has many advantages and one of them is the heatmap. It is used to analyse the behaviour of the team in general. Also, to fully know a particular player concerning his position on the pitch.
A heatmap can reveal issues that coaches and physical trainers do not see with the naked eye, so having that information becomes extremely important in decision-making.
The most curious heatmaps.
Throughout recent history, where heatmaps have become relevant, there have been some that have undoubtedly left more than one person with their mouth open.
The most iconic case was the Luis Suarez´s heatmap. After losing 8-2 against Bayern Munich, he ended up kicking off 9 times from the middle for Barcelona and the map ended up reflecting the following:
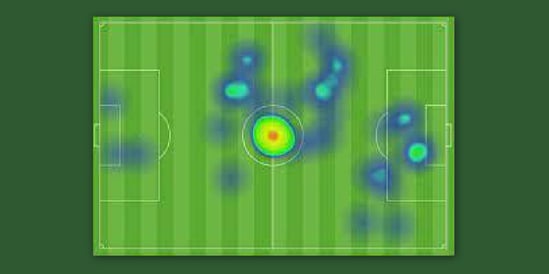
The historic 8-2 ended up creating one of the most curious heatmaps in Champions League history.
Deulofeu finished the match with 13 completed passes, no chances created and 4 corner kicks sent in, all without giving it to a team-mate.
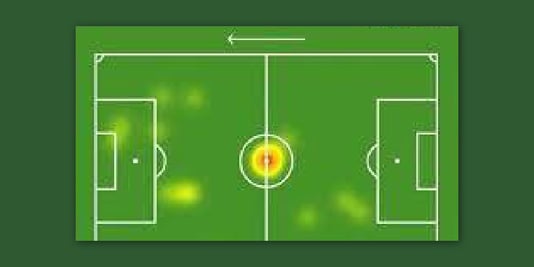
Finally, the emblematic case of this #Qatar2022: Onana, Cameroon's goalkeeper, ended up having a heatmap similar to that of a central defender. So much was the scandal about the way he played, that he ended up being taken out of the Cameroon goal by coach Song's decision.
Onana's heatmap against Switzerland. The Europeans ended up winning the match by 1-0.
OLIVER and the heatmaps.
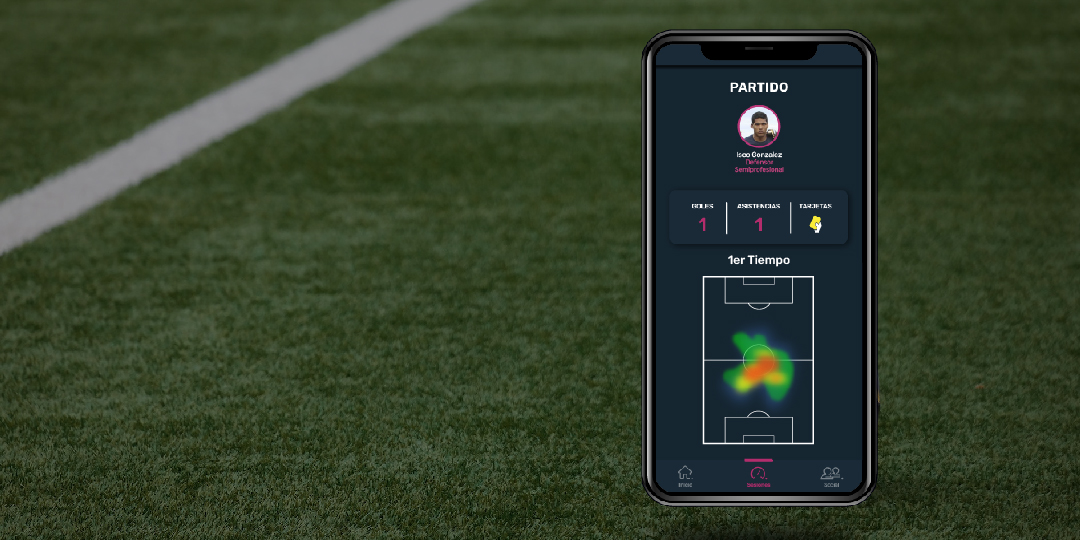
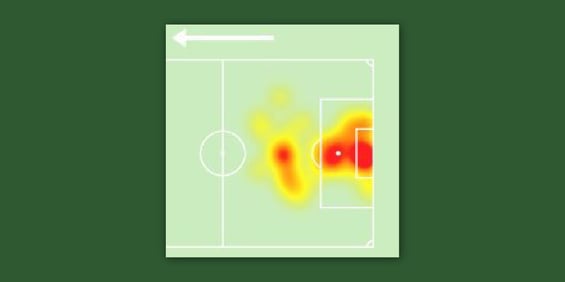
The new generation of GPS technology also has heatmaps as a tool. To have a heatmap, GPS collects hundreds of thousands of data to create each map for each player.
It is worth noting that OLIVER generates the heatmap through GPS data collection, rather than through "events". OLIVER effectively shows where a player was during the entire match, and not simply where he had acted with the ball.
For both teams and players, the user manually selects the playing field and then the application projects the heatmap onto the playing field. In this way, both players and coaches can take advantage of this information to enhance performance and improve performances.